Overview, Design concepts, and Details (ODD) Protocol of the model

Click here to download the extended ODD of the model
This page also has some of the images and tables from the ODD document
Fig. 1 shows the graphical user interface of the model. From top left, we have the spatial environment which the agents interact within; while charts monitor the dynamics of important system statistics over time such as the age distribution, household size, health statistics and refugees daily activities. We also provide a clock for time of day. A parameter window in the middle allows users to set different parameter values.
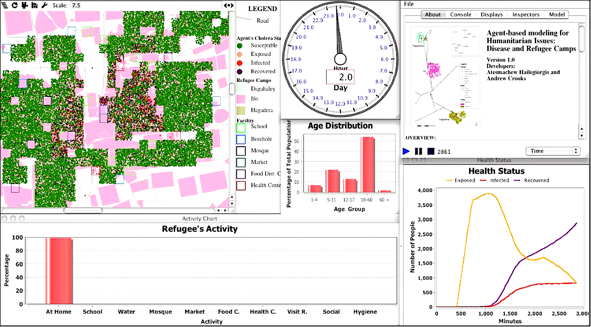
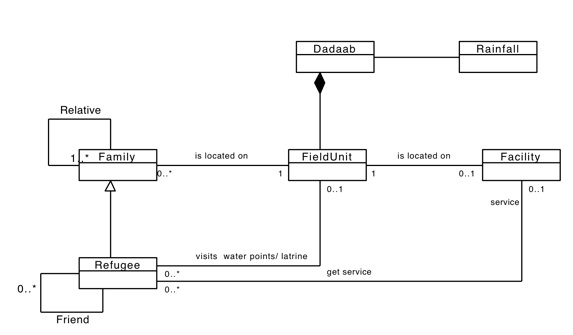
Fig. 2 shows the UML diagram of the model.
The main agent in the model is the refugee agent who represents an individual refugee who lives in the Dadaab refugee camps. Figure 3 shows the refugee agent properties.
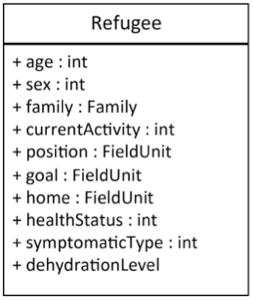
Fig. 3. High level representation of the model using UML diagram.
An agent’s movement from home to goal determined by the time and their success at the goal as shown in Fig. 4.
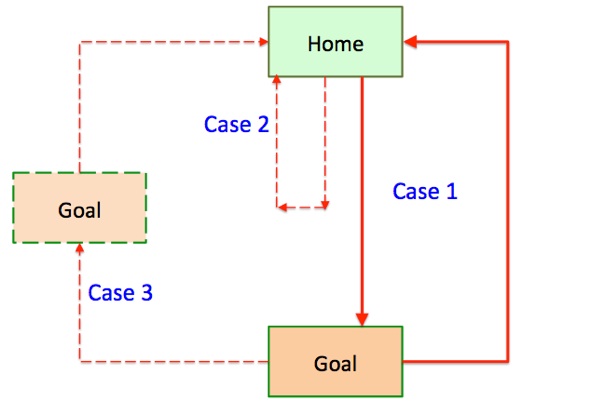
Fig. 4. Agent’s movement options between his home and his goal.
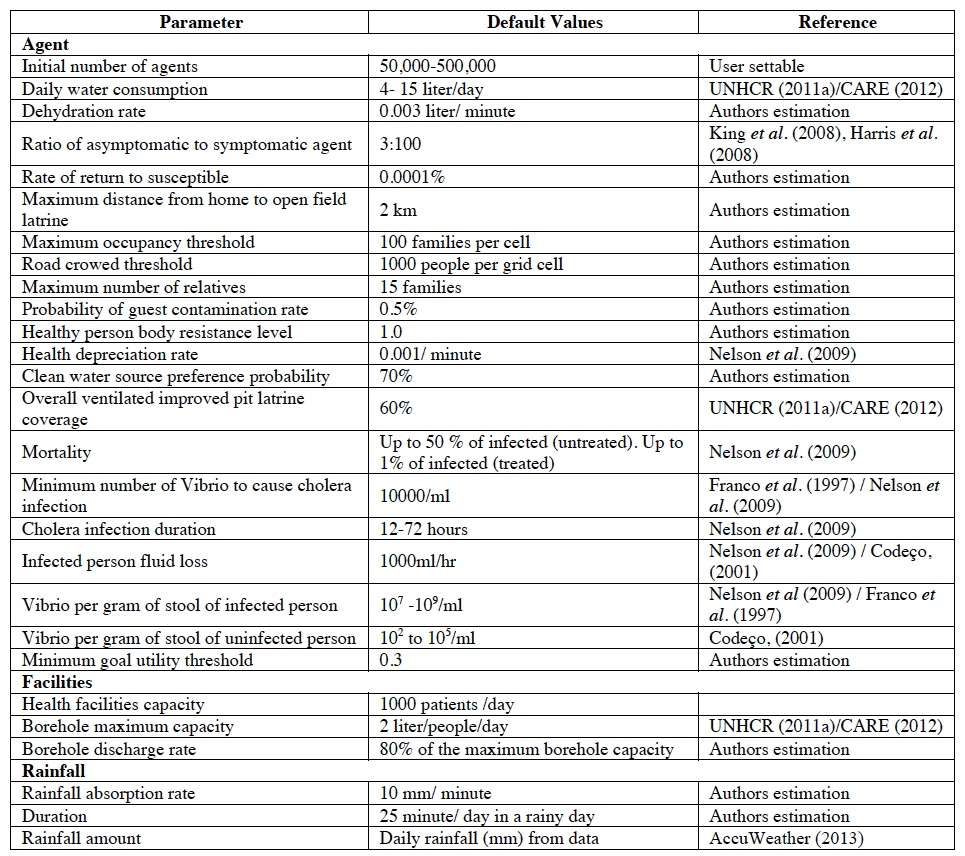
All the default values and the parameters are summarized in Table 1.
Table 1 Input parameters and variables.

A B
Fig. 5. Digital elevation data used within the model (A) and the resulting slope differentials (B) with the refugee camps superimposed on top of them
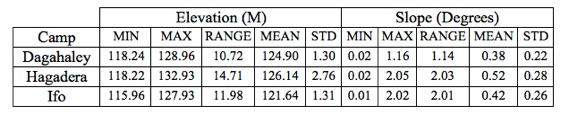
Table 2 Elevation and Slope statistics per camp
Susceptible – Exposed – Infected – Recovered (SEIR) model to capture the time between ingestion of contaminated water and showing the symptom is shown in All the refugee agents are considered as susceptible hosts as shown in Fig. 6.
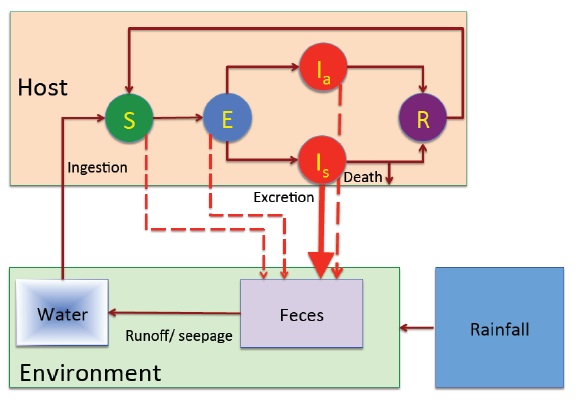
Fig. 6. Cholera transmission through the interaction of host and the environment. The progress of cholera transmission is represented as SEIR model. S = susceptible, E=Exposed, Ia= Infected (asymptomatic), Is= Infected (symptomatic), R= Revovered.